Intra-flow Loss Recovery and Control for
VoIP
Henning Sanneck1,
Nguyen Tuong Long Le1,
Adam Wolisz2, Georg Carle1
1GMD Fokus,
Kaiserin-Augusta-Allee 31, D-10589 Berlin, Germany
{sanneck, le, carle}@fokus.gmd.de
2Technical University
Berlin, Telecommunication Networks Group,
Sekr. FT 5-2, Einsteinufer 25, D-10587 Berlin, Germany
wolisz@ee.tu-berlin.de
Abstract
``Best effort'' packet-switched networks,
like the Internet, do not offer a reliable transmission of packets
to applications with real-time constraints such as voice. Thus, the
loss of packets impairs the application-level utility. For voice
this utility impairment is twofold: on one hand, even short bursts
of lost packets may decrease significantly the ability of the
receiver to conceal the packet loss and the speech signal playout
is interrupted. On the other hand, some packets may be particular
sensitive to loss as they carry more important information in terms
of user perception than other packets.
We first develop an end-to-end model based on loss run-lengths
with which we can describe the loss distribution within a flow.
These packet-level metrics are then linked to user-level objective
speech quality metrics. Using this framework, we find that for
low-compressing sample-based codecs (PCM) with loss concealment
isolated packet losses can be concealed well, whereas burst losses
have a higher perceptual impact. For high-compressing frame-based
codecs (G.729) on one hand the impact of loss is amplified through
error propagation caused by the decoder filter memories, though on
the other hand such coding schemes help to perform loss concealment
by extrapolation of decoder state. Contrary to sample-based codecs
we show that the concealment performance may ``break'' at
transitions within the speech signal however.
We then propose mechanisms which differentiate between packets
within a voice data flow to minimize the impact of packet loss. We
designate these methods as ``intra-flow'' loss recovery and
control. At the end-to-end level, identification of packets
sensitive to loss (sender) as well as loss concealment (receiver)
takes place. Hop-by-hop support schemes then allow to
(statistically) trade the loss of one packet, which is considered
more important, against another one of the same flow which is of
lower importance. As both packets require the same cost in terms of
network transmission, a gain in user perception is obtainable. We
show that significant speech quality improvements can be achieved
and additional data and delay overhead can be avoided while still
maintaining a network service which is virtually identical to best
effort in the long term.
Introduction
Considering that a real-time flow may experience some packet loss,
the impact of loss may vary significantly dependent on
which packets are lost within a flow. In the following we
distinguish two reasons for such a variable loss sensitivity:
- Temporal sensitivity: Loss of ADUs
![[*]](footnote.png) which is
correlated in time may lead to disruptions in the service. Note
that this effect is further aggravated by some interdependence
between ADUs (i.e., that one ADU can only be decoded when a
previous ADU before has successfully been received and decoded).
For voice, as a single packet contains typically several ADUs
(voice frames) this effect is thus more significant than e.g. for
video. It translates basically to isolated packet losses versus
losses that occur in bursts.
which is
correlated in time may lead to disruptions in the service. Note
that this effect is further aggravated by some interdependence
between ADUs (i.e., that one ADU can only be decoded when a
previous ADU before has successfully been received and decoded).
For voice, as a single packet contains typically several ADUs
(voice frames) this effect is thus more significant than e.g. for
video. It translates basically to isolated packet losses versus
losses that occur in bursts.
- Sensitivity due to ADU heterogeneity: Certain ADUs
might contain parts of the encoded signal which are more important
with regard to user perception than others of the same flow. Let us
consider a flow with two frame types of largely different
perceptual importance (we assume same size, frequency and no
inter-dependence between the frames). Under the loss of 50% of the
packets, the perceptual quality varies hugely between the case
where the 50% of the frames with high perceptual importance are
received and the case where the 50% less important frames are
received.
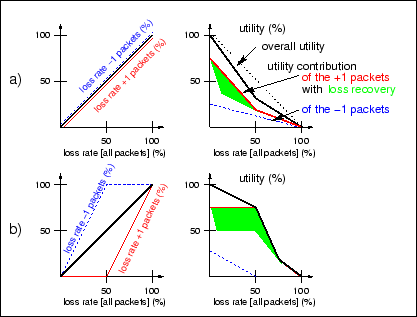
Figure 1: Schematic
utility functions dependent on the loss of more (+1) and less (-1)
important packets
|
|
Network support for real-time multimedia flows can on one hand aim
at offering a lossless service, which, however, to be implemented
within a packet-switched network, will be costly for the network
provider and thus for the user. On the other hand, within a lossy
service, the above sensitivity constraints must be taken into
account. It is our strong belief that this needs to be done in a
generic way, i.e., no application-specific knowledge (about
particular coding schemes e.g.) should be necessary within the
network and, vice versa, no knowledge about network specifics
should be necessary within an application. Let us now consider the
case that 50% of packets of a flow are identified as more important
(designated by ``+1'') or less important (``-1'') due to any of the
above sensitivity constraints. Figure 1 a) shows a generic utility
function describing the application-level Quality of Service (QoS)
dependent on the percentage of packets lost. For real-time
multimedia traffic, such utility should correspond to perceived
video/voice quality. If the relative importance of the packets is
not known by the transmission system, the loss rates for the +1 and
-1 packets are equal. Due to the over-proportional sensitivity of
the +1 packets to loss as well as the dependence of the end-to-end
loss recovery performance on the +1 packets, the utility function
is decreasing significantly in a non-linear way (approximated in
the figure by piece-wise linear functions) with an increasing loss
rate. Figure 1 b)
presents the case where all +1 packets are protected at the expense
of -1 packets. The decay of the utility function (for loss rates
< 50%) is reduced, because the +1
packets are protected and the end-to-end loss recovery can thus
operate properly over a wider range of loss rates indicated by the
shaded area. This results in a graceful degradation of the
application's utility. Note that the higher the non-linearity of
the utility contribution of the +1 packets is (deviation from the
dotted curve in Fig.
1 a), the higher is the potential gain in utility when the
protection for +1 packets is enabled. Results for actual perceived
quality as utility for multimedia applications exhibit such a
non-linear behavior.
To describe this effect and provide a taxonomy for different QoS
enhancement approaches, we introduce a novel terminology: we
designate mechanisms which influence QoS parameters between flows
(thus decrease the loss rate of one flow at the expense of other
flows) as inter-flow QoS. Schemes which, in the presence of
loss, differentiate between packets within a flow as demonstrated
in Figure 1 above,
provide intra-flow QoS enhancement. As QoS mechanisms have
to be implemented within the network (hop-by-hop) and/or in the end
systems (end-to-end), we have another axis of classification.
The adaptation of the sender's bitrate to the current network
congestion state as an intra-flow QoS scheme (loss
avoidance, [16]) is difficult
to apply to voice. Considering that voice flows have a very low
bitrate, the relative cost of transmitting the feedback information
is high (when compared e.g. to a video flow). To reduce this cost
the feedback interval would need to be increased, then leading to a
higher probability of wrong adaptation decisions. The major
difficulty, however, is the lack of a codec which is truly scalable
in terms of its output bitrate and corresponding perceptual
quality. Currently standardized voice codecs ([17]) usually only have a fixed output
bitrate. While it has been proposed to switch between voice codecs
([2]), the MOS (subjective quality)
values for the codecs employed do not differ much: e.g., the ITU
codecs G.723.1, G.729, G.728, G.726 and G.711 cover a bitrate range
from 5.3 kbit/s to 64 kbit/s while the subjective quality differs
by less than 0.25 on a 1-to-5 MOS scale ([4], 1: bad, 5: excellent quality). So when
the availability of sufficient computing power is assumed, the
lowest bitrate codec can be chosen permanently without actually
decreasing the perceptual quality.
For loss recovery on an end-to-end basis, due to the
real-time delay constraints, open-loop schemes like Forward Error
Correction (FEC) have been proposed ([2]). While such schemes are attractive
because they can be used on the Internet today, they also have
several drawbacks. The amount of redundant information needs to be
adaptive to avoid taking bandwidth away from other flows. This
adaptation is crucial especially when the fraction of traffic using
redundancy schemes is large ([8]).
If the redundancy is a source coding itself, like it has often been
proposed ([7]), the comments from
above on adaptation also apply. Using redundancy has also
implications to the playout delay adaptation ([10]) employed to de-jitter the packets at
the receiver. Note that the presented types of loss sensitivity
also apply to applications which are enhanced by end-to-end loss
recovery mechanisms. End-to-end mechanisms can reduce and shift
such sensitivities but cannot come close to eliminate them.
Therefore in this work we assume that the lowest possible
bitrate which provides the desired quality is chosen. Neither
feedback/adaptation nor redundancy is used, however, at the
end-to-end level, identification/marking of packets sensitive to
loss (sender) as well as loss concealment (receiver) takes place.
Hop-by-hop support schemes then allow trading the loss of one
packet, which is considered more important, against another one of
the same flow which is of lower importance. We employ actual codecs
and measure their utility in the presence of packet loss using
objective speech quality measurement.
The paper is structured as follows: Section Metrics introduces packet- and user-level
metrics. We employ these metrics to describe the sensitivity of
VoIP traffic to packet loss in section VoIP Loss Sensitivity. Section Queue Management for Intra-flow Loss Control briefly introduces a queue management
algorithm which can be used for intra-flow loss control. In
section Intra-flow Loss Recovery and Control, we
present results documenting the performance of the proposed
mechanisms at both the end-to-end and hop-by-hop level. Section Conclusions concludes the paper.
Metrics
Packet-level metrics
A general Markov model ([19,6]) which describes the loss process is
defined as follows:
Let 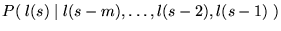 be
the state transition probability of a general Markov model of order
be
the state transition probability of a general Markov model of order
 , where
  is the
loss indicator function for the packet with the sequence number
is the
loss indicator function for the packet with the sequence number
 . All combinations for the values (
 and
and  ) of the sequence
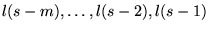 appear in the
state space. As an example
appear in the
state space. As an example 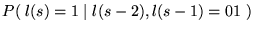 gives the
state transition probability when the current packet is lost, the previous packet
gives the
state transition probability when the current packet is lost, the previous packet  has
also been lost and packet
has
also been lost and packet  has not been
lost. The number of states of the model is
has not been
lost. The number of states of the model is  .
Two state transitions can take place from any of the states.
Thus, the number of parameters which have to be computed is
.
Two state transitions can take place from any of the states.
Thus, the number of parameters which have to be computed is  . Even for relatively small
this amount of parameters is difficult to be evaluated and
compared.
. Even for relatively small
this amount of parameters is difficult to be evaluated and
compared.
Table 1: State and transition
probabilities computed for an end-to-end Internet trace using a
general Markov model (third order) by Yajnik et. al. [9]
![State and transition
probabilities computed for an end-to-end Internet trace using a
general Markov model (third order) by Yajnik et. al. [9]](img18.png)
|
Table 1 shows some values
for the state and transition probabilities for a general Markov
model of third order measured end-to-end in the Internet by Yajnik
et. al. ([19]). It is interesting to
note that for all states with  the
probability for the next packet not to be lost (
the
probability for the next packet not to be lost ( ) is generally very high (
 , in bold typeface) whereas when
  the state transition probabilities to that event
cover the range of
the state transition probabilities to that event
cover the range of  to
to  .
That means that past ``no loss'' events do not affect the
loss process as much as past loss events. Intuitively this seems to
make sense, because a successfully arriving packet can be seen as a
indicator for congestion relief. Andren et. al. ([1]) as well as Yajnik et. al. ([20]) both confirmed this by measuring the
cross correlation of the loss- and no-loss-run-lengths. They came
to the result that such correlation is very weak. This implies that
patterns of short loss bursts interspersed with short periods of
successful packet arrivals occur rarely (note in this context that
in Table 1 the pattern
.
That means that past ``no loss'' events do not affect the
loss process as much as past loss events. Intuitively this seems to
make sense, because a successfully arriving packet can be seen as a
indicator for congestion relief. Andren et. al. ([1]) as well as Yajnik et. al. ([20]) both confirmed this by measuring the
cross correlation of the loss- and no-loss-run-lengths. They came
to the result that such correlation is very weak. This implies that
patterns of short loss bursts interspersed with short periods of
successful packet arrivals occur rarely (note in this context that
in Table 1 the pattern
 has by far the lowest state
probability).
has by far the lowest state
probability).
Thus, in the following we employ a model ([12]) which only
considers the past loss events for the state transition
probability. The number of states of the model can be reduced from
to  . This
means that we only consider the state transition probability
. This
means that we only consider the state transition probability
 with
with
![$l(s-k+i) = 1 \; \forall \; i \in [0, k-1]$](img27.png) ,
where
,
where  (
( ) is
a variable parameter. We define a loss run length for a sequence of
consecutively lost packets detected at
) is
a variable parameter. We define a loss run length for a sequence of
consecutively lost packets detected at  (
( ) with
  and
and ![$l(s_j-k+i) = 1 \; \forall \; i \in [0, k-1]$](img32.png) ,
,  being the -th ``burst
loss event''. Note that the parameters of the model become
independent of the sequence number and can now
rather be described by the occurence
being the -th ``burst
loss event''. Note that the parameters of the model become
independent of the sequence number and can now
rather be described by the occurence  of a
loss run length .
of a
loss run length .
We define the random variable  as
follows:
as
follows:  : ``no packet lost'',
  (
( ):
``exactly consecutive packets
lost'', and
):
``exactly consecutive packets
lost'', and  (): ``at least
consecutive packets lost''. With this definition, we establish a
loss run-length model with a finite number of states () which gives loss probabilities dependent on the
burst length. In the model, for every additional lost packet which
adds to the length of a loss burst a state transition takes place.
If a packet is successfully received, the state returns to . Thus, the state probability of the system for
is
(): ``at least
consecutive packets lost''. With this definition, we establish a
loss run-length model with a finite number of states () which gives loss probabilities dependent on the
burst length. In the model, for every additional lost packet which
adds to the length of a loss burst a state transition takes place.
If a packet is successfully received, the state returns to . Thus, the state probability of the system for
is  . Due to the limited memory of the system, the last state
 is just defined as `` consecutive packets lost'', with
  being the state probability. Given the case of a
finite number of packets
being the state probability. Given the case of a
finite number of packets  for a flow,
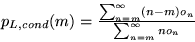
which experiences
for a flow,
which experiences  packet drops,
we have the relative frequency
packet drops,
we have the relative frequency  (
( for
for  ) for the
occurence of a loss burst of length . An
approximation for the expectation of the random variable can be computed as
) for the
occurence of a loss burst of length . An
approximation for the expectation of the random variable can be computed as  and
identified with the ``mean loss rate''. We can also approximate the
state probabilities of the model by the cumulative loss rate
and
identified with the ``mean loss rate''. We can also approximate the
state probabilities of the model by the cumulative loss rate
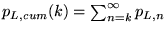 () and
 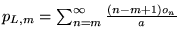 (
( ). The transition probabilities for
  can be computed easily as:
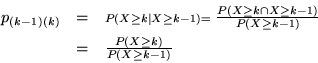
These conditional loss probabilities again can be approximated by
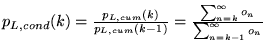 . For
. For  we have:
 (1)
(1)
Fig. 2 shows the
Markov chain for the model.
Figure 2: Loss run-length
model with states
|
![\includegraphics[scale=0.24]{ext_gilbert_finite.eps}](img57.png)
|
Additionally, we also define a random variable  which describes the distribution of burst loss lengths
with respect to the burst loss events (and
not to packet events like in the definition of
). We have the burst loss length rate
which describes the distribution of burst loss lengths
with respect to the burst loss events (and
not to packet events like in the definition of
). We have the burst loss length rate  as an estimate for
  . Thus, the mean
burst loss length is
. Thus, the mean
burst loss length is 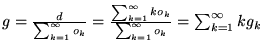 corresponding to
 ![$E[Y]$](img62.png) (average loss gap, [5]).
(average loss gap, [5]).
The run-length model implies a geometric distribution for
residing in state . For the probability of
a burst loss length of packets we thus
can compute estimates for performance parameters in a higher order
model representation (note that here represent
the random variable used in the higher-order models). For a three
state model we have e.g. for :
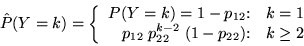 (2)
(2)
For the special case of a system with a memory of only the
previous packet ( ), we can use the
runlength distribution for a simple computation of the parameters
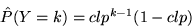
of the commonly-used Gilbert model (Fig. 3) to characterize the loss process
( being the associated random variable
with : ``no packet lost'',
), we can use the
runlength distribution for a simple computation of the parameters
of the commonly-used Gilbert model (Fig. 3) to characterize the loss process
( being the associated random variable
with : ``no packet lost'',  ``a packet lost''). Then the probability of
being in state can be seen as the
unconditional loss probability ulp and approximated by the
mean loss (
``a packet lost''). Then the probability of
being in state can be seen as the
unconditional loss probability ulp and approximated by the
mean loss ( ). Only one
conditional loss probability clp for the transition
). Only one
conditional loss probability clp for the transition  exists:
 (3)
(3)
If losses of one flow are correlated (i.e., the loss probability of
an arriving packet is influenced by the contribution to the state
of the queue by a previous packet of the same flow and/or both the
previous and the current packet see bursty arrivals of other
traffic, [15]) we have  and thus
  . For
. For  the
Gilbert model is equivalent to a 1-state (Bernouilli) model with
the
Gilbert model is equivalent to a 1-state (Bernouilli) model with
 (no loss correlation).
Figure 3: Loss run-length
model with two states (Gilbert model)
|
![\includegraphics[scale=0.25]{gilbert.eps}](img73.png)
|
As in equation 2 we
can compute an estimate for the probability of a burst loss length
of packets for a higher order model
representation:
 (4)
(4)
Objective Speech Quality Metrics
Unlike the conventional methods like the Signal-to-Noise Ratio
( ), novel objective quality measures
attempt to estimate the subjective quality as closely as possible
by modeling the human auditory system. In our evaluation we use two
objective quality measures: the Enhanced Modified Bark Spectral
Distortion (EMBSD, [21]) and the
Measuring Normalizing Blocks (MNB) described in the Appendix II of
the ITU-T Recommendation P.861 ([18]). These two objective quality measures
are reported to have a very high correlation with subjective tests,
their relation to the range of subjective test result values (MOS)
is close to being linear and they are recommended as being suitable
for the evaluation of speech degraded by transmission errors in
real network environments such as bit errors and frame erasures
([18,21]). Both metrics are distance measures,
i.e., a result value of 0 implies perfect quality, the larger the
value, the worse the speech quality is (in Fig. 5 we show an axis with approximate
corresponding MOS values). For all simulations in this paper we
employed both schemes. As they yielded very similar results (though
MNB results generally exhibited less variability) we only present
EMBSD results.
), novel objective quality measures
attempt to estimate the subjective quality as closely as possible
by modeling the human auditory system. In our evaluation we use two
objective quality measures: the Enhanced Modified Bark Spectral
Distortion (EMBSD, [21]) and the
Measuring Normalizing Blocks (MNB) described in the Appendix II of
the ITU-T Recommendation P.861 ([18]). These two objective quality measures
are reported to have a very high correlation with subjective tests,
their relation to the range of subjective test result values (MOS)
is close to being linear and they are recommended as being suitable
for the evaluation of speech degraded by transmission errors in
real network environments such as bit errors and frame erasures
([18,21]). Both metrics are distance measures,
i.e., a result value of 0 implies perfect quality, the larger the
value, the worse the speech quality is (in Fig. 5 we show an axis with approximate
corresponding MOS values). For all simulations in this paper we
employed both schemes. As they yielded very similar results (though
MNB results generally exhibited less variability) we only present
EMBSD results.
VoIP Loss Sensitivity
Figure 4: Components of
the end-to-end loss recovery/control measurement setup.
|
![\includegraphics[scale=0.38]{measurement_generic_recovery.eps}](img76.png)
|
Figure 4 shows the
components of the measurement setup which we will use to evaluate
our approach to combined end-to-end and hop-by-hop loss recovery
and control. The shaded boxes show the components in the data path
where mechanisms of loss recovery are located. Together with the
parameters of the network model (section Packet-level metrics) and the perceptual model we
obtain a measurement setup which allows us to map a specific PCM
signal input to a speech quality measure. While using a simple
end-to-end loss characterization, we generate a large number of
loss patterns by using different seeds for the pseudo-random number
generator (for the results presented here we used  patterns for each simulated condition for a single
speech sample). This procedure takes thus into account that the
impact of loss on an input signal may not be homogenous (i.e., a
loss burst within one segment of that signal can have a different
perceptual impact than a loss burst of the same size within another
segment). By averaging the result of the objective quality measure
for several loss patterns, we have a reliable indication for the
performance of the codec operating under a certain network loss
condition. We employed a Gilbert model (Fig. 3) as the network model for the
simulations, as we have found that here higher order models do not
provide much additional information.
patterns for each simulated condition for a single
speech sample). This procedure takes thus into account that the
impact of loss on an input signal may not be homogenous (i.e., a
loss burst within one segment of that signal can have a different
perceptual impact than a loss burst of the same size within another
segment). By averaging the result of the objective quality measure
for several loss patterns, we have a reliable indication for the
performance of the codec operating under a certain network loss
condition. We employed a Gilbert model (Fig. 3) as the network model for the
simulations, as we have found that here higher order models do not
provide much additional information.
Temporal sensitivity
PCM
We first analyze the behaviour for  -law PCM
flows (64 kbit/s) with and without loss concealment, where the loss
concealment repairs isolated losses only (speech stationarity can
only be assumed for small time intervals). Results are shown for
the AP/C concealment algorithm ([11]). Similar results were obtained with
other concealment algorithms. Figure 5 shows the case without loss
concealment enabled where Gilbert model parameters are varied. The
resulting speech quality is insensitive to the loss distribution
parameter (
-law PCM
flows (64 kbit/s) with and without loss concealment, where the loss
concealment repairs isolated losses only (speech stationarity can
only be assumed for small time intervals). Results are shown for
the AP/C concealment algorithm ([11]). Similar results were obtained with
other concealment algorithms. Figure 5 shows the case without loss
concealment enabled where Gilbert model parameters are varied. The
resulting speech quality is insensitive to the loss distribution
parameter ( ). The results are even slightly
decreasing for an increasing , pointing to a
significant variability of the results. In Figure 6 the results with loss concealment
are depicted. When the loss correlation () is
low, loss concealment provides a significant performance
improvement. The relative improvement increases with increasing
loss (
). The results are even slightly
decreasing for an increasing , pointing to a
significant variability of the results. In Figure 6 the results with loss concealment
are depicted. When the loss correlation () is
low, loss concealment provides a significant performance
improvement. The relative improvement increases with increasing
loss ( ). For higher
values the cases with and without concealment become
increasingly similar and show the same performance at
). For higher
values the cases with and without concealment become
increasingly similar and show the same performance at  . Figures 5 and 6 respectively also contain a curve
showing the performance under the assumption of random losses
(Bernouilli model, ). Thus,
considering a given , a worst case loss
pattern of alternating losses (
. Figures 5 and 6 respectively also contain a curve
showing the performance under the assumption of random losses
(Bernouilli model, ). Thus,
considering a given , a worst case loss
pattern of alternating losses ( ![$l(s \bmod 2) = 1, l([s+1] \bmod 2) = 0$](img82.png) )
would enable a considerable performance improvement (with
)
would enable a considerable performance improvement (with  :
:  , Eq.
3).
, Eq.
3).
Figure 5: Utility curve
for PCM without loss concealment (EMBSD)
|
![\includegraphics[scale=0.37]{nofec_objectiveX.eps}](img85.png)
|
Figure 6: Utility curve
for PCM with loss concealment (EMBSD)
|
![\includegraphics[scale=0.38]{apc_objectiveX.eps}](img86.png)
|
Figure 7: Variability of
the perceptual distortion with loss concealment (EMBSD)
|
![\includegraphics[scale=0.40]{apc_objective_error.eps}](img87.png)
|
As we found by visual inspection that the distributions of the
perceptual distortion values for one loss condition seem to
approximately follow a normal distribution we employ mean and
standard deviation to describe the statistical variability of the
measured values. Figure 7 presents the perceptual
distortion as in the previous figure but also give the standard
deviation as error bars for the respective loss condition. It shows
the increasing variability of the results with increasing loss
correlation (), while the variability does
not seem to change much with an increasing amount of loss (). On one hand this points to some, though weak,
sensitivity with regard to heterogeneity (i.e., it matters which
area of the speech signal (voiced/unvoiced) experiences a burst
loss). On the other hand it shows, that a large number of different
loss patterns is necessary for a certain speech sample when using
objective speech quality measurement to assess the impact of loss
correlation on user perception.
G.729
Figure 8: Utility curve
for the G.729 codec (EMBSD)
|
![\includegraphics[scale=0.40]{step1_embsd_ic01.eps}](img88.png)
|
G.729 ([17]) uses the Conjugate
Structure Algebraic Code Excited Linear Prediction (CS-ACELP)
coding scheme and operates at 8 kbit/s. In G.729, a speech frame is
10 ms in duration. For each frame, the G.729 encoder analyzes the
input data and extracts the parameters of the Code Excited Linear
Prediction (CELP) model such as linear prediction filter
coefficients and excitation vectors. When a frame is lost or
corrupted, the G.729 decoder uses the parameters of the previous
frame to interpolate those of the lost frame. The line spectral
pair coefficients (LSP) of the last
good frame are repeated and the gain coefficients are taken from
the previous frame but they are damped to gradually reduce their
impact. When a frame loss occurs, the decoder cannot update its
state, resulting in a divergence of encoder and decoder state.
Thus, errors are not only introduced during the time period
represented by the current frame but also in the following ones. In
addition to the impact of the missing codewords, distortion is
increased by the missing update of the predictor filter memories
for the line spectral pairs and the linear prediction synthesis
filter memories. Figure
8 shows that for similar network conditions the output quality
of the G.729 is worse than
PCM with loss concealment, demonstrating the compression versus
quality tradeoff under packet loss. Interestingly the loss
correlation ( parameter) has some impact on
the speech quality, however, the effect is weak pointing to a
certain robustness of the G.729 codec with regard to the resiliency
to consecutive packet losses due to the internal loss concealment.
Rosenberg has done a similar experiment ([9]), showing that the difference between
the original and the concealed signal with increasing loss
burstiness in terms of a mean-squared error is significant,
however. This demonstrates the importance of perceptual metrics
which are able to include concealment (and not only reconstruction)
operations in the quality assessment.
Sensitivity due to ADU heterogeneity
PCM is a memoryless encoding. Therefore the ADU content is only
weakly heterogeneous (Figure 7). Thus, in this section we
concentrate on the G.729 codec. The experiment we carry out is to
measure the resynchronization time of the decoder after consecutive frames are lost. The G.729 decoder is
said to have resynchronized with the encoder when the energy of the
error signal falls below one percent of the energy of the decoded
signal without frame loss (this is equivalent to a signal-to-noise
ratio () threshold of  ). The error signal energy (and thus the ) is computed on a per-frame basis. Figure 9 shows the resynchronization time
(expressed in the number of frames needed until the threshold is
exceeded) plotted against the position of the loss (i.e., the index
of the first lost frame) for different values of
. The speech sample is produced by a male speaker where an
unvoiced/voiced (
). The error signal energy (and thus the ) is computed on a per-frame basis. Figure 9 shows the resynchronization time
(expressed in the number of frames needed until the threshold is
exceeded) plotted against the position of the loss (i.e., the index
of the first lost frame) for different values of
. The speech sample is produced by a male speaker where an
unvoiced/voiced ( ) transition occurs in
the eighth frame.
) transition occurs in
the eighth frame.
We can see from Figure 9
that the position of a frame loss has a significant influence on
the resulting signal degradation, while the
degradation is not that sensitive to the length of the frame loss
burst . The loss of unvoiced frames seems to
have a rather small impact on the signal degradation and the
decoder recovers the state information fast thereafter. The loss of
voiced frames causes a larger degradation of the speech signal and
the decoder needs more time to resynchronize with the sender.
However, the loss of voiced frames at an unvoiced/voiced transition
leads to a significant degradation of the signal. We have repeated
the experiment for different male and female speakers and obtained
similar results. Taking into account the used coding scheme, the
above phenomenon could be explained as follows: Because voiced
sounds have a higher energy than unvoiced sounds, the loss of
voiced frames causes a larger signal degradation than the loss of
unvoiced frames. However, due to the periodic property of voiced
sounds, the decoder can conceal the loss of voiced frames well once
it has obtained sufficient information on them. The decoder fails
to conceal the loss of voiced frames at an unvoiced/voiced
transition because it attempts to conceal the loss of voiced frames
using the filter coefficients and the excitation for an unvoiced
sound. Moreover, because the G.729 encoder uses a moving average
filter to predict the values of the line spectral pairs and only
transmits the difference between the real and predicted values, it
takes a lot of time for the decoder to resynchronize with the
encoder once it has failed to build the appropriate linear
prediction filter.
Queue Management for Intra-flow Loss Control
Figure 10:
''Differential'' RED drop probabilities as a function of average
queue sizes
|
![\includegraphics[scale=0.32]{diffred.eps}](img92.png)
|
While we have highlighted the sensitivity of VoIP traffic to the
distribution of loss in the last sections, we now want to briefly
introduce a queue management mechanism ([13]) which is able to enforce
the relative preferences of the application with regard to loss.
We consider flows with packets marked with ``+1'' and ``-1'' (as
described in the introduction) as ``foreground traffic'' (FT) and
other (``best effort'') flows as ``background traffic'' (BT).
Packet marking, in addition to keeping the desirable property of
state aggregration within the network core as proposed by the IETF
Differentiated Services architecture, is exploited here to convey
the intra-flow requirements of a flow. As it should be avoided to
introduce reordering of the packets of a flow in the network we
consider mechanisms for the management of a single queue with
different priority levels. One approach to realize inter-flow
service differentiation using a single queue is RIO ('RED with IN
and OUT', [3]). With RIO, two
average queue sizes as congestion indicators are computed: one just
for the IN (high priority) packets and another for both IN and OUT
(low priority) packets. Packets marked as OUT are dropped earlier
(in terms of the average queue size) than IN packets. RIO has been
designed to decrease the seen by
particular flows at the expense of other flows. In this work,
however, we want to keep the as given by
other parameters while modifying the loss distribution for the
foreground traffic (FT). This amounts to trading the loss of a
``+1'' packet against a ``-1'' packet of the same flow (in a
statistical sense). Fig.
10 shows the conventional RED drop probability curve ( as a function of the average queue size for all
arrivals
as a function of the average queue size for all
arrivals  ), which is applied to all unmarked
(``'') traffic (background traffic: BT).
), which is applied to all unmarked
(``'') traffic (background traffic: BT).
The necessary relationship between the drop probabilities for
packets marked as "-1" and ``+1'' can be derived as follows (note
that this relationship is valid both at the end-to-end level and
every individual hop): Let  be the overall
number of emitted packets by an FT flow and
be the overall
number of emitted packets by an FT flow and ![$a_x, x \in [-1,0,+1]$](img96.png) be the number of
packets belonging to a certain class (where the ``0'' class
corresponds to (unmarked) ``best effort'' traffic). Then, with
be the number of
packets belonging to a certain class (where the ``0'' class
corresponds to (unmarked) ``best effort'' traffic). Then, with
 and
considering that the resulting service has to be best effort in the
long term, we have:
and
considering that the resulting service has to be best effort in the
long term, we have:
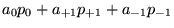


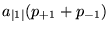


 (5)
(5)
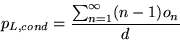
Due to this relationship between the drop probability for ``+1''
and ``-1'' packets, we designate this queue management algorithm as
``Differential'' RED (DiffRED). Figure 10 shows the corresponding drop
probability curves. Due to the condition of in
addition to the conventional RED behaviour, the DiffRED
implementation should also monitor the  and
and
 arrival processes. If the ratio of
to packets
at a gateway is not (either due to
misbehaving flows or a significant number of flows which have
already experienced loss at earlier hops) the
loss probability is decreased and the
probability is increased at the same time thus degrading the
service for all users. The shaded areas above and below the
p
arrival processes. If the ratio of
to packets
at a gateway is not (either due to
misbehaving flows or a significant number of flows which have
already experienced loss at earlier hops) the
loss probability is decreased and the
probability is increased at the same time thus degrading the
service for all users. The shaded areas above and below the
p curve (Fig. 10) show the operating area when this
correction is added.
curve (Fig. 10) show the operating area when this
correction is added.
In [13] it has been
shown that using only the conventional RED average queue size
for DiffRED operation is not
sufficient. This is due to the potentially missing correlation of
the computed value between consecutive
and
arrivals, especially when the share of the FT traffic is low. As
this might result in a unfair distribution of losses between the FT
and BT fractions, a specific  value is
computed by sampling the queue size only at FT arrival instants.
Thus, a service differentiation for foreground traffic is possible
which does not differ from conventional RED behaviour in the long
term average (i.e., in the ).
value is
computed by sampling the queue size only at FT arrival instants.
Thus, a service differentiation for foreground traffic is possible
which does not differ from conventional RED behaviour in the long
term average (i.e., in the ).
Intra-flow loss recovery and control
Temporal sensitivity
Considering a flow with temporal loss sensitivity, paragraph 3.1.1 has shown that a simple,
periodic loss pattern enhances the performance of the end-to-end
loss recovery. The pattern is not tied to particular packets,
therefore a per-flow characterization with the introduced metrics
is applicable. In this paragraph we assume that a flow expressed
its temporal sensitivity by marking its flow with an alternating
pattern of ``+1''/``-1''.
Figures 11 and 12 show the rates
for the actual and the estimated burst loss lengths for a
three-state ( ) and a two=state (, Gilbert) model respectively. We can
observe that DiffRED shapes the burst probability curve in the
desired way. Most of the probability mass is concentrated at
isolated losses (the ideal behaviour would be the occurence of only
isolated losses (
) and a two=state (, Gilbert) model respectively. We can
observe that DiffRED shapes the burst probability curve in the
desired way. Most of the probability mass is concentrated at
isolated losses (the ideal behaviour would be the occurence of only
isolated losses ( ) which can be
expressed with
) which can be
expressed with  in terms of Gilbert
model parameters). With Drop Tail an approximately geometrically
decreasing burst loss probability with increasing burst length
(Eq. 4) is
obtainable, where the parameter is relatively
large though. Thus, considering voice with temporal loss
sensitivity as the foreground traffic of interest, with DiffRED a
large number of short annoying bursts can be traded against a
larger number of isolated losses and few long loss bursts (which
occur when the queue is under temporary overload, i.e.,
in terms of Gilbert
model parameters). With Drop Tail an approximately geometrically
decreasing burst loss probability with increasing burst length
(Eq. 4) is
obtainable, where the parameter is relatively
large though. Thus, considering voice with temporal loss
sensitivity as the foreground traffic of interest, with DiffRED a
large number of short annoying bursts can be traded against a
larger number of isolated losses and few long loss bursts (which
occur when the queue is under temporary overload, i.e.,  , Fig. 10).
Figure 11: Comparison of
actual and estimated burst loss length rates as a function of burst
length : three state run-length-based
model
|
![\includegraphics[width=1.0\columnwidth]{errorbar_runlength_estimate_ic01.eps}](img114.png)
|
Figure 12: Comparison of
actual and estimated burst loss length rates as a function of burst
length : two state run-length-based model
(Gilbert)
|
![\includegraphics[width=1.0\columnwidth]{errorbar_gilbert_estimate_ic01.eps}](img115.png)
|
We can see that the three-state model estimation (Eq. 2) reflects the two areas of
the DiffRED operation (the sharp drop of the burst loss length rate
for  and the decrease along a
geometrically decreasing asymptote for
and the decrease along a
geometrically decreasing asymptote for  ). This effect cannot be captured by the two state model
(Eq. 4) which thus
overestimates the burst loss length rate for
and then hugely underestimates it for . Interestingly, for Drop Tail, while both models
capture the shape of the actual curve, the lower order model is
more accurate in the estimation. This can be explained as follows:
if the burst loss length probabilities are in fact close to a
geometrical distribution, the estimate is more robust if all data
is included (note that the run-length based approximation of the
conditional loss probability
only includes loss run-length occurences larger or equal to : Eq. 1).
). This effect cannot be captured by the two state model
(Eq. 4) which thus
overestimates the burst loss length rate for
and then hugely underestimates it for . Interestingly, for Drop Tail, while both models
capture the shape of the actual curve, the lower order model is
more accurate in the estimation. This can be explained as follows:
if the burst loss length probabilities are in fact close to a
geometrical distribution, the estimate is more robust if all data
is included (note that the run-length based approximation of the
conditional loss probability
only includes loss run-length occurences larger or equal to : Eq. 1).
Sensitivity due to ADU heterogeneity
In paragraph 3.1.2 we
have seen that sensitivity to ADU heterogeneity results in a
certain non-periodic loss pattern. Thus, a mechanism at (or near)
the sender is necessary which derives that pattern from the voice
data. Furthermore, an explicit cooperation between end-to-end and
hop-by-hop mechanisms is necessary (Fig. 4).
We use the result of paragraph
3.2 to develop a new packet marking scheme called Speech
Property-Based Selective Differential Packet Marking
(SPB-DIFFMARK). The DIFFMARK scheme concentrates the higher
priority packets on the frames essential to the speech signal and
relies on the decoder's concealment for other frames.
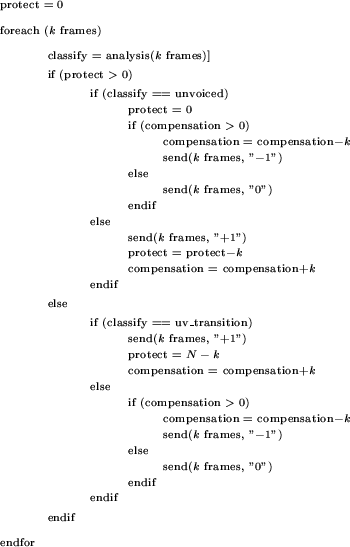
Figure 13: SPB-DIFFMARK
Pseudo Code
|
Figure 13 shows the simple
algorithm written in a pseudo-code that is used to detect an
unvoiced/voiced () transition and protect
the voiced frames at the beginning of a voiced signal. The
procedure analysis() is used to classify a block of
frames as voiced, unvoiced, or transition. send() is used to send a block
of frames as a single packet with the
appropriate priority (either "+1", "0" or "-1"). As the core
algorithm gives only a binary marking decision (protect the packet
or not), we employ a simple algorithm to send the necessary ``-1''
packets for compensation (Eq. 5):
after a burst of "+1" packets has been sent, a corresponding number
of "-1" packets is sent immediately. State about the necessary
number of to-be-sent "-1" packets is kept in the event that the SPB
algorithm triggers the next "+1" burst before all "-1" packets
necessary for compensation are sent. Thus, seen over time intervals
which are long compared to the / burst times, the mean loss for the flow will be
equal to the "best effort" case (Eq.
5).  is a pre-defined value and defines
how many frames at the beginning of a voiced signal are to be
protected. Our simulations (Fig. 9) have shown that the range from
is a pre-defined value and defines
how many frames at the beginning of a voiced signal are to be
protected. Our simulations (Fig. 9) have shown that the range from
 to
to  are
appropriate values for (depending on
the network loss condition). In the simulations presented below, we
choose , a typical value for interactive
speech transmissions over the Internet (
are
appropriate values for (depending on
the network loss condition). In the simulations presented below, we
choose , a typical value for interactive
speech transmissions over the Internet ( of audio data per packet). A larger number of
would help to reduce the relative overhead of the protocol header
but also increases the packetization delay and makes sender
classification and receiver concealment in case of packet loss (due
to a larger loss gap) more difficult.
of audio data per packet). A larger number of
would help to reduce the relative overhead of the protocol header
but also increases the packetization delay and makes sender
classification and receiver concealment in case of packet loss (due
to a larger loss gap) more difficult.
End-to-end simulation description
Due to the non-periodic loss pattern, we need to explicitly
associate a drop probability with a single packet within an
end-to-end model. Therefore we use a separate one-state Markov
model (Bernouilli model) to describe the network behaviour as seen
by each class of packets. "Best effort" packets (designated by "0"
in Fig. 14) are dropped
with the probability , whereas packets marked
with ``+1'' and ``-1'' are dropped with probabilities of  and
and  respectively. This is a reasonable assumption with regard
to the interdependence of the different classes in fact, as it has
been shown that DiffRED (Figs. 11 and 12) achieves a fair
amount of decorrelation of +1 and -1 packet losses. Nevertheless to
include some correlation between the classes we have set
respectively. This is a reasonable assumption with regard
to the interdependence of the different classes in fact, as it has
been shown that DiffRED (Figs. 11 and 12) achieves a fair
amount of decorrelation of +1 and -1 packet losses. Nevertheless to
include some correlation between the classes we have set  for the
subsequent simulations. This should also allow a reasonable
evaluation of how losses in the +1 class affect the performance of
the SPB-algorithms.
for the
subsequent simulations. This should also allow a reasonable
evaluation of how losses in the +1 class affect the performance of
the SPB-algorithms.
Figure 14: Marking schemes
and corresponding network models.
|
![\includegraphics[scale=0.26]{mark_schemes.eps}](img126.png)
|
For a direct comparison with SPB-DIFFMARK, we evaluate a scheme
where packets are alternatingly marked as being either "-1" or "+1"
(ALT-DIFFMARK, Figure
14). We furthermore include related inter-flow loss protection
schemes. The first scheme uses full protection (FULL MARK, all
packets are marked as "+1"). The SPB-MARK scheme operates similarly
to SPB-DIFFMARK, but no ``-1'' packets are sent for compensation
(those packets are also marked as ``0''). For comparison we again
use a scheme where packets are alternatingly marked as being either
"0" or "+1" (ALT-MARK). Finally, packets of pure "best effort"
flows are dropped with the probability (NO
MARK case in Fig. 14).
For the SPB marking schemes the percentage of "+1"- and
``-1''-marked packets respectively is  for the speech material used. We obtained similar marking
percentages for other speech samples. The ALT marking schemes mark
exactly
for the speech material used. We obtained similar marking
percentages for other speech samples. The ALT marking schemes mark
exactly  of their packets as being
``+1''.
of their packets as being
``+1''.
Results
Figure 15 shows the
perceptual distortion for the marking schemes dependent on the drop
probability . The unprotected case ("NO
MARK") has the highest perceptual distortion and thus the worst
speech quality. The
differential marking scheme (SPB-DIFFMARK) offers a significantly
better speech quality even when only using a network service which
amounts to "best effort" in the long term. Note that the
ALT-DIFFMARK marking strategy does not differ from the "best
effort" case (which confirms the result of paragraph G.729). SPB-DIFFMARK is also even
better than the inter-flow QoS ALT-MARK scheme, especially for
higher values of . These results validate
the strategy of our SPB marking schemes that do not equally mark
all packets with a higher priority but rather protect a subset of
frames that are essential to the speech quality.
Figure 15: Perceptual
Distortion (EMBSD) for the marking schemes and SPB-FEC
|
![\includegraphics[scale=0.5]{spbmark_embsd.eps}](img129.png)
|
The SPB-FEC scheme ([12]), which uses
redundancy piggybacked
on the main payload packets (RFC 2198, [7]) to protect a subset of the packets,
enables a very good output speech quality for low loss rates.
However, it should be noted that the amount of data sent over the
network is increased by . Note that
the simulation presumes that this additionally consumed bandwidth
itself does not contribute significantly to congestion. This
assumption is only valid if a small fraction of traffic is voice
([8]). The SPB-FEC curve is convex
with increasing , as due to the
increasing loss correlation an increasing number of consecutive
packets carrying redundancy are lost leading to unrecoverable
losses. The curve for SPB-DIFFMARK is concave, however, yielding
better performance for  .
.
The inter-flow QoS ALT-MARK scheme (
of the packets are marked) enhances the perceptual quality.
However, the auditory distance and the perceptual distortion of the
SPB-MARK scheme (with of all packets
marked) is significantly lower and very close to the quality of the
decoded signal when all packets are marked (FULL MARK). This also
shows that by protecting the entire flow only a minor improvement
in the perceptual quality is obtained. The results for the FULL
MARK scheme also show that, while the loss of some of the +1
packets has some measurable impact, the impact on perceptual
quality can still be considered to be very low.
Conclusions
In this paper we have characterized the behaviour of a sample-based
codec (PCM) and a frame-based codec (G.729) in the presence of
packet loss. We have then developed ``intra-flow'' loss recovery
and control mechanisms to increase the perceptual quality. While we
have tested other codecs only informally, we think that our results
reflect the fundamental difference between codecs which either
encode the speech waveform directly or which are based on linear
prediction. For PCM without loss concealment we have found that it
neither exhibits significant temporal sensitivity nor sensitivity
to payload heterogeneity. With loss concealment, however, the
speech quality is increased but the amount of increase exhibits
strong temporal sensitivity. Frame-based codecs amplify on one hand
the impact of loss by error propagation, though on the other hand
such coding schemes help to perform loss concealment by
extrapolation of decoder state. Contrary to sample-based codecs we
have shown that the concealment performance of the G.729 decoder
may ``break'' at transitions within the speech signal however, thus
showing strong sensitivity to payload heterogeneity.
We have briefly introduced a queue management algorithm which is
able to control loss patterns without changing the amount of loss
and characterized its performance for the loss control of a flow
exhibiting temporal sensitivity. Then we developed a new packet
marking scheme called Speech Property-Based Selective Differential
Packet Marking for an efficient protection of frame-based codecs.
The SPB-DIFFMARK scheme concentrates the higher priority packets on
the frames essential to the speech signal and relies on the
decoder's concealment for other frames. We have also evaluated the
mapping of an end-to-end algorithm to inter-flow protection. We
have found that the selective marking scheme performs almost as
good as the protection of the entire flow at a significantly lower
number of necessary high-priority packets.
Thus, combined intra-flow end-to-end / hop-by-hop schemes seem
to be well-suited for heavily-loaded networks with a relatively
large fraction of voice traffic. This is the case because they
neither need the addition of redundancy nor feedback (which would
incur additional data and delay overhead) and thus yield stable
voice quality also for higher loss rates due to absence of FEC and
feedback loss. Such schemes can better accomodate codecs with fixed
output bitrates, which are difficult to integrate into FEC schemes
requiring adaptivity of both the codec and the redundancy
generator. Also, it is useful for adaptive codecs running at the
lowest possible bitrate. Avoiding redundancy and feedback is also
interesting in multicast conferencing scenarios where the
end-to-end loss characteristics of the different paths leading to
members of the session are largely different. Our work has clearly
focused on linking simple end-to-end models which can be easily
parametrized with the known characteristic of hop-by-hop loss
control to user-level metrics. An analysis of a large scale
deployment of non-adaptive or adaptive FEC as compared to a
deployment of our combined scheme requires clearly further
study.
Acknowledgments
We would like to thank Wonho Yang and Robert Yantorno, Temple
University, for providing the EMBSD software for the objective
speech quality measurements. Michael Zander, GMD Fokus, helped with
the simulations of the queue management schemes.
Bibliography
- 1
- J. Andren, M. Hilding, and D. Veitch.
Understanding end-to-end internet traffic dynamics.
In Proceedings IEEE GLOBECOM, Sydney, Australia, November
1998.
- 2
- J.-C. Bolot, S. Fosse-Parisis, and D. Towsley.
Adaptive FEC-based error control for interactive audio in the
Internet.
In Proceedings IEEE INFOCOM, New York, NY, March
1999.
- 3
- D. Clark and W. Fang.
Explicit allocation of best effort packet delivery service.
Technical Report, MIT LCS, 1997.
http://diffserv.lcs.mit.edu/Papers/exp-alloc-ddc-wf.pdf.
- 4
- R. Cox and P. Kroon.
Low bit-rate speech coders for multimedia communication.
IEEE Communications Magazine, pages 34-41, December
1996.
- 5
- J. Ferrandiz and A. Lazar.
Consecutive packet loss in real-time packet traffic.
In Proceedings of the Fourth International Conference on Data
Communications Systems, IFIP TC6, pages 306-324, Barcelona,
June 1990.
- 6
- W. Jiang and H. Schulzrinne.
QoS measurement of Internet real-time multimedia services.
In Proceedings NOSSDAV, Chapel Hill, NC, June 2000.
- 7
- C. Perkins, I. Kouvelas, O. Hodson,
M. Handley, and J. Bolot.
RTP payload for redundant audio data.
RFC 2198, IETF, September 1997.
ftp://ftp.ietf.org/rfc/rfc2198.txt.
- 8
- M. Podolsky, C. Romer, and S. McCanne.
Simulation of FEC-based error control for packet audio on the
Internet.
In Proceedings IEEE INFOCOM, pages 48-52, San Francisco,
CA, March 1998.
- 9
- J. Rosenberg.
G. 729 error recovery for Internet Telephony.
Project report, Columbia University, 1997.
- 10
- J. Rosenberg, L. Qiu, and H. Schulzrinne.
Integrating packet FEC into adaptive voice playout buffer
algorithms on the Internet.
In Proceedings IEEE INFOCOM, Tel Aviv, Israel, March
2000.
- 11
- H. Sanneck.
Concealment of lost speech packets using adaptive
packetization.
In Proceedings IEEE Multimedia Systems, pages 140-149,
Austin, TX, June 1998.
ftp://ftp.fokus.gmd.de/pub/glone/papers/Sann9806_Adaptive.pdf.
- 12
- H. Sanneck.
Packet Loss Recovery and Control for Voice Transmission over
the Internet.
PhD thesis, GMD Fokus / Telecommunication Networks Group, Technical
University of Berlin, October 2000.
http://sanneck.net/research/publications/thesis/Sann0010_Loss.pdf.
- 13
- H. Sanneck and G. Carle.
A queue management algorithm for intra-flow service differentiation
in the "best effort" Internet.
In Proceedings of the Eighth Conference on Computer
Communications and Networks (ICCCN), pages 419-426, Natick,
MA, October 1999.
ftp://ftp.fokus.gmd.de/pub/glone/papers/Sann9910_Intra-Flow.pdf.
- 14
- H. Sanneck, N. Le, and A. Wolisz.
Efficient QoS support for Voice-over-IP applications using
selective packet marking.
In Special Session on Error Control Techniques for Real-time
Delivery of Multimedia data, First International Workshop on
Intelligent Multimedia Computing (IMMCN), pages 553-556,
Atlantic City, NJ, February 2000.
ftp://ftp.fokus.gmd.de/pub/glone/papers/Sann0002_VoIP-marking.pdf.
- 15
- H. Schulzrinne, J. Kurose, and D. Towsley.
Loss correlation for queues with bursty input streams.
In Proceedings ICC, pages 219-224, Chicago, IL, 1992.
- 16
- D. Sisalem and A. Wolisz.
LDA+ TCP-friendly adaptation: A measurement and comparison
study.
In Proceedings NOSSDAV, Chapel Hill, NC, June 2000.
- 17
- International Telecommunication Union.
Coding of speech at 8 kbit/s using conjugate-structure
algebraic-code-excited linear-prediction (CS-ACELP).
Recommendation G.729, ITU-T, March 1996.
- 18
- International Telecommunication Union.
Objective quality measurement of telephone-band (300-3400 Hz)
speech codecs.
Recommendation P.861, ITU-T, February 1998.
- 19
- M. Yajnik, J. Kurose, and D. Towsley.
Packet loss correlation in the MBone multicast network:
Experimental measurements and markov chain models.
Technical Report 95-115, Department of Computer Science, University
of Massachusetts, Amherst, 1995.
- 20
- M. Yajnik, S. Moon, J. Kurose, and
D. Towsley.
Measurement and modelling of the temporal dependence in packet
loss.
Technical Report 98-78, Department of Computer Science, University
of Massachusetts, Amherst, 1998.
- 21
- W. Yang and R. Yantorno.
Improvement of MBSD by scaling noise masking threshold and
correlation analysis with MOS difference instead of MOS.
In Proceedings ICASSP, pages 673-676, Phoenix, AZ, March
1999.
Footnotes
- ... ADUs
- Application Data Unit: the unit of data emitted by a source
coder such as a video or voice frame.
- ... behavior
- While we have obtained results which confirm the shape of the
``overall utility'' curve shown in Fig. 1, clearly the utility functions
of the +1/-1 ``sub''-flows and their relationship are more complex
and only approximately additive.
- ... (LSP
- LSPs are another representation of the linear prediction
coefficients.
- ... G.729
- Two G.729 frames are contained in a packet.
- ... degradation
- While on one hand we see that measures
often do not correlate well with subjective speech quality, on the
other hand the large differences in the
-threshold-based resynchronization time clearly point to a
significant impact on subjective speech quality.
- ... respectively
- We only discuss the results qualitatively here to give an
example how an intra-flow loss control algorithm performs and to
show how loss models can capture this performance. Details on the
simulation scenario and parameters can be found in [12].
- ... assumption
- The appropriateness of the simple end-to-end modeling used has
been investigated in [12] with discrete
event simulation using a multi-hop topology and detailed modeling
of foreground and background traffic sources.
- ... quality
- We have also performed informal listening tests which confirmed
the results using the objective metrics.
- ... redundancy
- We also used the G.729 encoder for the redundant source
coding.
Copyright © 2001
ACM.
![\includegraphics[scale=0.44]{resync_timeX.eps}](img91.png)